

In the ever-evolving landscape of digital marketing, it’s no secret that the success of a website is intrinsically linked to the user experience it offers. A seamless, intuitive, and engaging user experience is the cornerstone of driving higher conversion rates and, ultimately, achieving your marketing goals. To excel in this realm, we need more than just a hunch or gut feeling – we need concrete data and insights. This is where analytics comes into play. In this comprehensive guide, we will explore how to use analytics to improve website user experience and optimise conversions.
The Essence of User Experience
Before we dive into the analytical aspect, let’s establish a solid understanding of what user experience (UX) means. In essence, UX is the emotional response that a user has when interacting with a website, app, or any digital product. A positive UX creates a sense of satisfaction, while a negative one can lead to frustration and abandonment.
To deliver a winning UX, we must first:
1. Define Your Audience
Understanding your target audience is paramount. Analysing demographic data, preferences, and behaviour patterns can help you tailor your website to their specific needs and expectations. By creating user personas based on data, you can effectively address the pain points and preferences of different segments of your audience, thus creating more tailored content and experiences.
2. Setting the stage with Responsive Design
A responsive website design ensures that your site functions seamlessly on all devices. This is the foundation for a great user experience. The importance of responsive design cannot be overstated, as the majority of web traffic now comes from mobile devices. It’s essential to use responsive design principles to adapt your website to various screen sizes, ensuring that all users have a consistent and enjoyable experience.
The Role of Analytics in User Experience
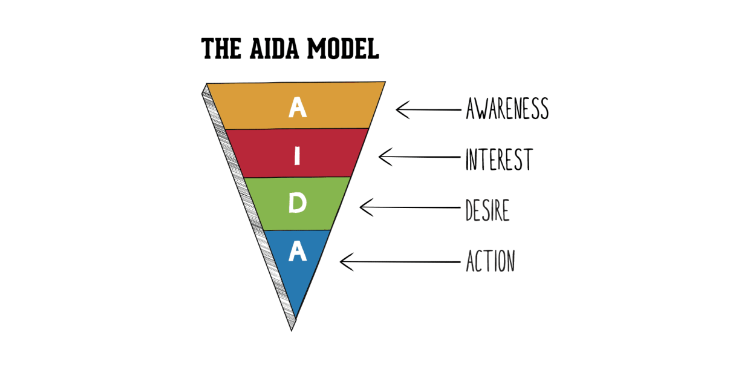
Now that we have a solid UX foundation, let’s explore how analytics can take it to the next level. The AIDA (Attention, Interest, Desire, Action) model plays a crucial role in this context.
Attention: Measuring the First Impression
The “Attention” phase of AIDA is all about grabbing the user’s interest right from the start. Analytics tools like Google Analytics and Hotjar can help you evaluate:
- Bounce rates: High bounce rates, in the context of the “Attention” phase, are akin to a red flag, signalling that a significant portion of your visitors are swiftly departing your website without delving further. This abrupt exit can be symptomatic of several issues, and it’s your job to dissect these signals to uncover the underlying challenges.
- Time on page: Time on page is a vital metric that offers insights into how long users engage with your content. In the context of the “Attention” phase, this metric is particularly significant. Longer time on page generally indicates that your content is holding users’ attention, which is a strong indicator of success. Conversely, shorter times on page may signal a problem, and your goal is to uncover the underlying issues.
Interest: Analysing User Engagement
Once you’ve gained your audience’s attention, you need to maintain their interest. Analytics can help by examining:
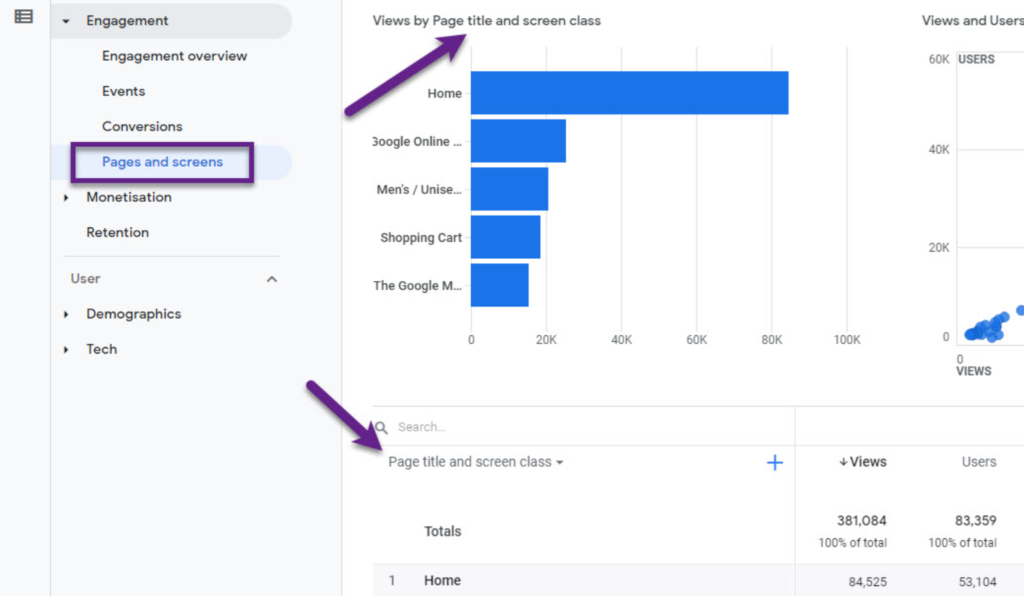
- Page views: Page views are a fundamental metric for gauging user engagement. The number of pages a user visits is a strong indicator of their interest in your content. It’s not just about the quantity of pages viewed, but also the quality of those interactions.
Average Session Duration: This metric reveals the average amount of time users spend on your site during a single session. A longer average session duration indicates that users are exploring your content in-depth. Conversely, a short duration may suggest that users aren’t finding the content engaging.
Number of Returning Visitors: The frequency with which users return to your site can be a testament to the ongoing interest in your content. Returning visitors often indicate a level of loyalty or continued curiosity.
Scroll depth: Understanding how far users scroll on a page is essential for assessing their level of interest and engagement. This metric, known as scroll depth, helps you pinpoint where users may be losing interest as they traverse your content.
Scroll-depth data can provide insights into whether your content is well-structured and compelling. Users are more likely to scroll deeper if the content maintains their interest. On the other hand, shallow scroll depths might indicate that users are losing interest quickly. Use this information to optimise your content for better engagement.
Desire: Fostering User Desire through Analytics
As you venture into the “Desire” phase of the AIDA model, your mission is to foster and intensify the user’s desire for your product or service. In this pivotal phase, analytics serves as a guiding light, aiding you in nurturing this desire through various techniques and insights such as:
- Conversion funnels: Conversion funnels are your windows into understanding the journey users undertake as they progress through various stages of the conversion process. This analytical tool helps you identify any bottlenecks or obstacles that might deter users from reaching the final conversion point. In essence, it’s a roadmap that highlights where users drop off and the areas that require optimisation.
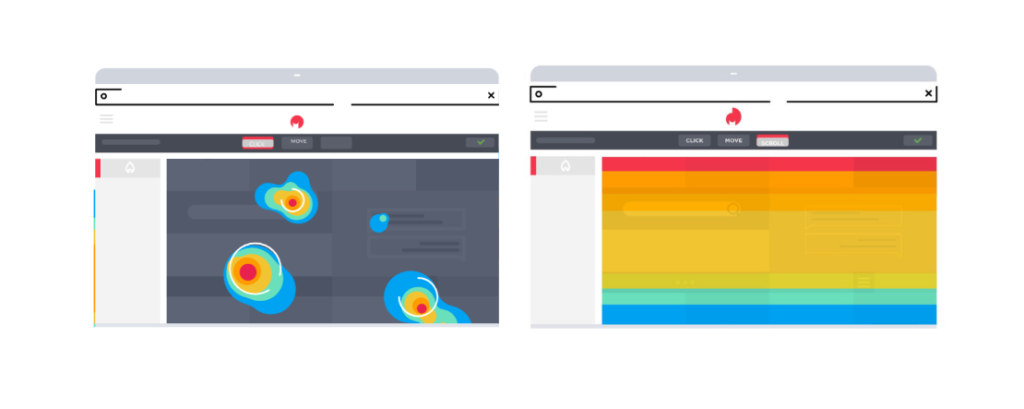
- Heatmaps: Heatmaps are powerful visual representations that illustrate how users interact with your website. They reveal where users click, move their mouse cursor, or tap on mobile devices. The information captured in heatmaps can be harnessed to optimise your calls to action (CTAs) and other essential elements of your pages.
Action: Encouraging Conversions with Analytics
The culmination of all marketing endeavours is the encouragement of a desired action – a conversion. In this final stage of the AIDA model, where you seek to prompt users to take that pivotal action, analytics emerges as a critical ally. It provides the insights and data-driven strategies required to encourage these actions effectively.
- Conversion tracking: Conversion tracking is a fundamental aspect of the “Action” phase. By implementing conversion tracking in Google Analytics, you gain the ability to assess how effectively your website is at driving the desired actions. It’s a multidimensional tool that allows you to set specific conversion goals tailored to your unique objectives. These goals can encompass various actions such as sign-ups, purchases, form submissions, or any other valuable engagement metrics. The data gleaned from conversion tracking acts as a compass, guiding you to optimise your website for these predefined goals.
- A/B testing: A/B testing is a powerful strategy to determine what exactly converts best. It enables you to experiment with different variations of your CTAs, landing pages, and other crucial website elements.

A/B testing tools also enable you to test various elements, such as headlines, images, and colours, to determine the best-performing combinations. Use the data from these tests to make data-driven decisions about your website’s design and content.
Unleashing the Power of Data
Now that we’ve established how analytics aligns with the AIDA model, it’s time to delve into the intricacies of data-driven optimisation. In the realm of digital marketing, data is not just a valuable asset; it’s the lifeblood that courses through every campaign, interaction, and decision. Understanding the multifaceted landscape of data-driven optimisation is essential for marketing professionals.
Setting Up Analytics Tools
Choosing the right analytics tools is crucial for any marketer. Google Analytics is the most commonly used platform that provides a wealth of valuable insights, including audience demographics, user behaviour, and conversion tracking.
When setting up analytics tools, it is essential to define your key performance indicators (KPIs) and goals. Depending on your specific objectives, these KPIs can include conversion rate, click-through rate, session duration, and more. By aligning your analytics setup with your goals, you can accurately measure your success.
User Behavior Analysis
Dig deeper into user behaviour to pinpoint areas of improvement. Google Analytics and similar tools offer data on:
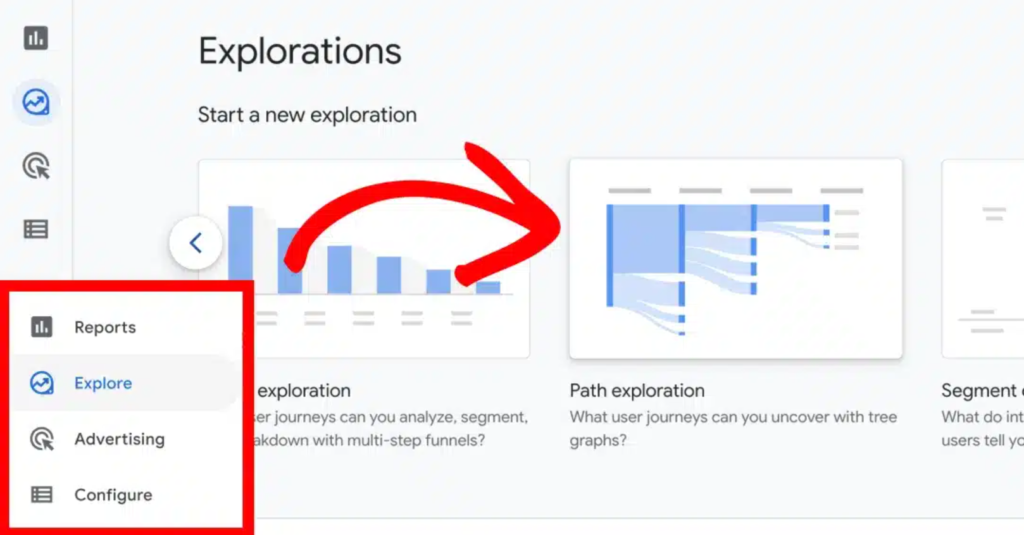
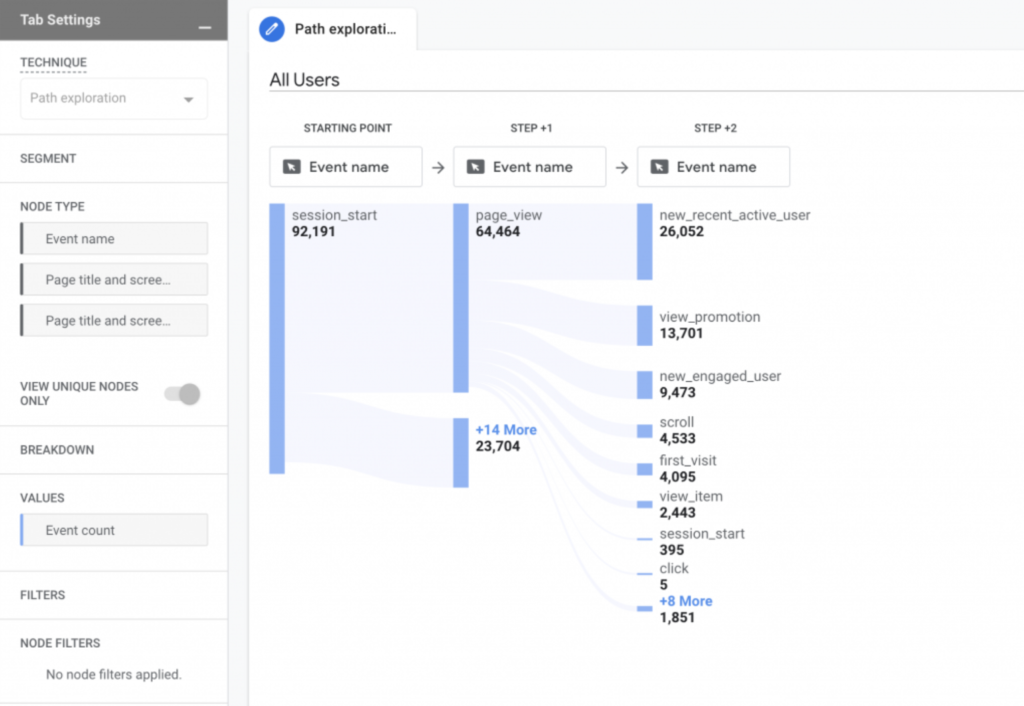
User flow: User flow analysis is like being a digital detective, unravelling the paths users traverse on your site. With the aid of Google Analytics, you can trace these paths and, more importantly, identify the exact locations where users tend to drop off. These exit points are the treasure troves of insight, showing you precisely where your optimisation efforts need to be focused.
As you uncover these exit points, you can strategise and make targeted changes. Is there a confusing form on a particular page? Is the content not as engaging as it should be? Do users encounter a roadblock in their journey? By knowing where users exit, you can work on removing these barriers and crafting a smoother and more engaging user experience.
Site search: Analysing what users are searching for on your website can provide valuable insights into their needs and intentions. This information is like a goldmine for tailoring your content and navigation to meet those needs effectively.
Do users search for specific products, services, or information that’s not readily accessible? Is there a gap in your content that users are desperately trying to fill through searches? The answers to these questions can guide your content creation, ensuring you provide what your audience is actively seeking.
Analysing Customer Feedback
Combining quantitative data with qualitative insights is a recipe for success. Customer feedback can come from sources like surveys, reviews, or customer support interactions. This data often contains priceless information about pain points and areas for improvement.
It’s crucial to actively seek and analyse customer feedback. Consider implementing user surveys, feedback forms, and review monitoring to gather valuable insights into what your audience thinks about your website. Take both positive and negative feedback into account and use it to inform your optimisation strategies.
Personalisation for Enhanced User Experience
Personalisation is a key aspect of delivering an exceptional user experience. By leveraging analytics, you can tailor content and features to individual user preferences. This not only boosts user engagement but also drives higher conversions.
- User Segmentation: Analytics tools allow you to segment your audience based on various criteria, such as demographics, behaviour, and preferences. By dividing your users into distinct groups, you can create personalised content, product recommendations, and offers.
- Dynamic Content: Dynamic content adapts in real-time to user behaviour. For instance, you can display personalised product recommendations, content suggestions, or even location-based information. Analytics can identify user actions and preferences, enabling you to serve the most relevant content at the right moment, which is a powerful tool for enhancing the user experience.
- Page Load Times: Analytics tools, such as Google PageSpeed Insights, can provide detailed reports on your website’s load times. You can use this data to optimise images, reduce unnecessary scripts, and enhance server response times, ultimately improving the overall user experience.
- Mobile-Friendly Design: With the increasing use of mobile devices, it’s essential to ensure that your website is mobile-friendly. Analytics can reveal which devices visitors are using and how they interact with your site. Use this information to fine-tune your mobile design, making it more user-friendly and responsive.
Continuous Improvement
User experience optimisation is an ongoing process. Regularly monitoring analytics data, conducting A/B tests, and seeking user feedback are essential to maintaining a high-quality user experience.
A/B Testing
A/B testing should be an ongoing practice. Continuously experiment with different variations of your website elements to identify what resonates best with your audience. Use analytics to track the performance of these tests and iterate to improve user engagement and conversions.
Data-Driven Decision Making
Ensure that data remains at the core of your decision-making process. Regularly analyse your analytics data to identify trends, issues, and opportunities. To foster data-driven decision-making, establish a routine for reviewing and analysing your analytics data. Consider setting up regular reporting and dashboards to track key performance indicators (KPIs) and identify trends, anomalies, or areas for improvement. Use this data to make informed decisions and develop optimisation strategies.

In the realm of digital marketing, leveraging analytics to improve website user experience is not merely an option; it’s a necessity. A solid understanding of the AIDA model and the ways analytics align with it can be a game-changer for marketers looking to boost conversions. By setting up the right analytics tools, analysing user behaviour, optimising content, and implementing conversion strategies, you can create a website that not only engages users but also turns them into loyal customers.
Remember, website optimisation is an ongoing journey – commit to constant improvement and stay informed about the latest trends to ensure your success in the digital landscape. With analytics as your compass, you’re well on your way to achieving your marketing goals and beyond.