In the ever-evolving digital ecosystem, businesses are drowning in data. However, not all data is created equal. KPIs are the compass that guides decision-making and strategic planning.
Why KPIs Matter in the Digital Age
The role of Key Performance Indicators (KPIs) has become nothing short of pivotal. KPIs are quantifiable metrics that gauge the success of a business in achieving its strategic objectives. In the digital landscape, where the speed of information can make or break a brand, understanding and harnessing the power of KPIs is indispensable. Let’s delve deeper into the profound significance of KPIs and why they stand as the linchpin of modern business strategies.
Measuring Progress and Success:
At the heart of KPIs lies the ability to measure progress and success with clarity and precision. These metrics act as the compass guiding businesses toward their goals by providing tangible evidence of achievements or areas that need improvement. Whether it’s tracking website traffic, conversion rates, or customer satisfaction, KPIs offer a quantifiable snapshot of a business’s overall health.
Strategic Alignment:
KPIs are not arbitrary numbers; they are carefully selected metrics that align with an organisation’s strategic goals. By defining and monitoring KPIs, businesses ensure that every action and decision contributes directly to overarching objectives. This alignment fosters focus and ensures that efforts are directed toward activities that genuinely move the needle in terms of business success.
Performance Evaluation:
Understanding how well your strategies are performing is paramount. KPIs serve as a comprehensive performance evaluation tool, allowing businesses to gauge the effectiveness of their marketing campaigns, customer service initiatives, and overall operational efficiency. Through this lens, organisations can identify areas of strength and weakness, enabling data-driven decisions for continuous improvement.
Real-Time Insights:
One of the defining features of KPIs in the digital age is their capacity to provide real-time insights. In an environment where trends shift rapidly and consumer behaviours evolve, the ability to access up-to-the-minute data is invaluable. KPIs empower businesses to make agile, informed decisions, responding promptly to emerging opportunities or addressing challenges before they escalate.
Data-Driven Decision Making:
In a world awash with information, businesses must sift through the noise to extract meaningful insights. KPIs facilitate data-driven decision-making by offering a focused lens on the metrics that truly matter. By relying on concrete data rather than intuition, businesses can make informed choices, mitigating risks and capitalising on opportunities with a greater chance of success.
Accountability and Transparency:
KPIs instill a sense of accountability and transparency within an organisation. When employees have clear, quantifiable targets to meet, it fosters a culture of accountability. Furthermore, transparent communication of KPIs across departments ensures that everyone is aligned with the organisation’s goals, creating a shared sense of purpose and direction.
Adaptability to Change:
The digital landscape is in a perpetual state of flux, with technology, consumer preferences, and market dynamics evolving at an unprecedented pace. KPIs provide businesses with the adaptability needed to navigate this change. By regularly reviewing and adjusting KPIs, organisations can stay agile, pivot strategies when necessary, and remain resilient in the face of uncertainty.
In essence, KPIs are the vital signs of a business in the digital age. They offer a comprehensive, real-time diagnosis of performance, enabling businesses to not only survive but thrive in an ever-shifting landscape. By understanding the nuanced role of KPIs and integrating them into every facet of operations, businesses can elevate themselves from mere participants to leaders in the digital revolution.
Types of KPIs: Navigating the Analytics Landscape

The diverse nature of KPIs allows businesses to tailor their analytics strategies to specific objectives. Let’s delve into three essential distinctions within the realm of KPIs to better navigate the analytics landscape:
1. Leading vs. Lagging KPIs
Leading Indicators:
Leading KPIs are forward-looking metrics that provide insight into future performance. They act as early signals, offering a glimpse into potential trends or shifts in the market. For instance, website traffic might be a leading indicator, suggesting increased interest before actual conversions occur. By focusing on leading KPIs, businesses can proactively adjust strategies to capitalise on emerging opportunities or mitigate potential challenges.
Lagging Indicators:
Lagging KPIs, on the other hand, are retrospective metrics that measure past performance. These indicators are often the outcomes of earlier actions and strategies. Examples include revenue figures, customer retention rates, or the number of completed transactions. While lagging indicators don’t provide immediate insights, they are crucial for assessing the impact of past decisions and identifying areas for improvement.
Balancing Act:
A balanced approach to both leading and lagging KPIs is essential for a comprehensive understanding of business performance. Leading indicators guide proactive decision-making, while lagging indicators offer a retrospective lens, enabling businesses to learn from past experiences and refine their strategies for the future.
2. Quantitative vs. Qualitative KPIs
Quantitative Metrics:
Quantitative KPIs deal with numerical, measurable data. Examples include conversion rates, revenue figures, click-through rates, and website traffic. These metrics provide clear, objective insights into performance and are essential for gauging the effectiveness of various strategies. Quantitative KPIs are particularly valuable for making data-driven decisions and assessing the success of marketing campaigns and operational efficiency.
Qualitative Insights:
Qualitative KPIs, in contrast, focus on subjective, non-numeric data that provides a deeper understanding of customer behaviour, preferences, and satisfaction. Examples include customer feedback, sentiment analysis, and user experience assessments. While qualitative insights may not be as easily measurable, they offer invaluable context, helping businesses understand the “why” behind certain quantitative outcomes.
Striking the Balance:
A successful analytics strategy strikes the right balance between quantitative and qualitative KPIs. While quantitative metrics provide hard data for decision-making, qualitative insights offer a nuanced understanding of customer sentiments and motivations, informing strategies that go beyond the numbers.
3. Vanity Metrics vs. Actionable Metrics
Vanity Metrics:
Vanity metrics may look impressive on the surface but often lack direct correlation with business success. Examples include social media likes, page views, or download numbers. While these metrics might offer a temporary ego boost, they don’t necessarily contribute to meaningful business outcomes. Falling into the trap of solely focusing on vanity metrics can lead to misguided strategies that don’t drive true value.
Actionable Metrics:
Actionable metrics, on the other hand, are directly tied to specific actions that can be taken to improve performance. These metrics provide insights that lead to informed decision-making and tangible improvements in business outcomes. For instance, conversion rates, customer acquisition costs, and customer lifetime value are actionable metrics that guide strategies for enhanced performance.
Discerning Value:
Differentiating between vanity metrics and actionable metrics is crucial for an effective analytics strategy. While vanity metrics may offer a quick glance at popularity, actionable metrics drive real business growth by providing insights that lead to concrete, strategic actions.
In navigating the analytics landscape, a nuanced understanding of these distinctions empowers businesses to choose and leverage the right KPIs for their unique goals. By embracing the diversity of KPIs, businesses can unlock a more holistic view of their performance and pave the way for strategic, data-driven success.
Setting the Stage: Choosing the Right KPIs for Your Business

Not all KPIs are created equal, and choosing the right ones requires a deep understanding of your business model, industry, and objectives. Follow this step-by-step guide to navigate the intricate process of selecting KPIs that matter most for your business:
1. Clarify Your Business Objectives and Goals
In analytics, KPIs should directly contribute to achieving your business objectives, such as improving website performance, increasing conversion rates, or optimising marketing campaigns.
2. Identify Key Stakeholders and Departments
Different departments may have distinct priorities and perspectives. Understanding the needs and expectations of each stakeholder group ensures a comprehensive approach to KPI selection and implementation.
3. Conduct a SWOT Analysis
Perform a thorough SWOT (Strengths, Weaknesses, Opportunities, Threats) analysis for your business. Identify areas where you excel and those that need improvement. This analysis will help pinpoint which aspects of your business demand closer monitoring through KPIs.
4. Map KPIs to Customer Journey Stages
Understanding the customer journey through analytics KPIs at different stages allows you to measure and optimise user interactions, from website visits to conversion events and ongoing engagement.
5. Engage in Collaborative Goal-Setting
For analytics, collaborative goal-setting ensures that the chosen KPIs align with specific measurable objectives, such as improving user engagement, reducing bounce rates, or enhancing data accuracy.
6. Benchmark Against Industry Standards
Research and benchmark your business against industry standards. Understanding how your KPIs compare to industry averages provides context and helps set realistic targets. It also sheds light on areas where you may need to outperform competitors to gain a competitive edge.
7. Evaluate Data Availability and Accessibility
Assessing the availability and accessibility of data is crucial for analytics KPIs. Ensure that the necessary data points can be collected and analysed to measure the chosen KPIs accurately.
8. Prioritise KPIs Based on Impact
Prioritising KPIs based on impact is vital in analytics. Focus on metrics that directly influence the success of your analytics strategies, such as those related to data accuracy, user behaviour analysis, and conversion optimisation.
9. Ensure Alignment with Company Culture
Aligning analytics KPIs with your company’s culture involves selecting metrics that resonate with the values and priorities of your organisation, fostering a data-driven culture.
10. Establish a KPI Monitoring and Review System
Setting up a robust monitoring and review system ensures that you track analytics KPIs regularly, allowing for quick adjustments and optimisations based on real-time data.
11. Embrace Iterative Improvement
Recognising that analytics is an evolving field, adopting an iterative approach to KPI selection ensures that your metrics remain relevant and adaptive to changes in the digital landscape.
Analysing and Interpreting Data
Data is only as valuable as the insights it provides.

Data Visualisation Techniques
Power of Visual Representation:
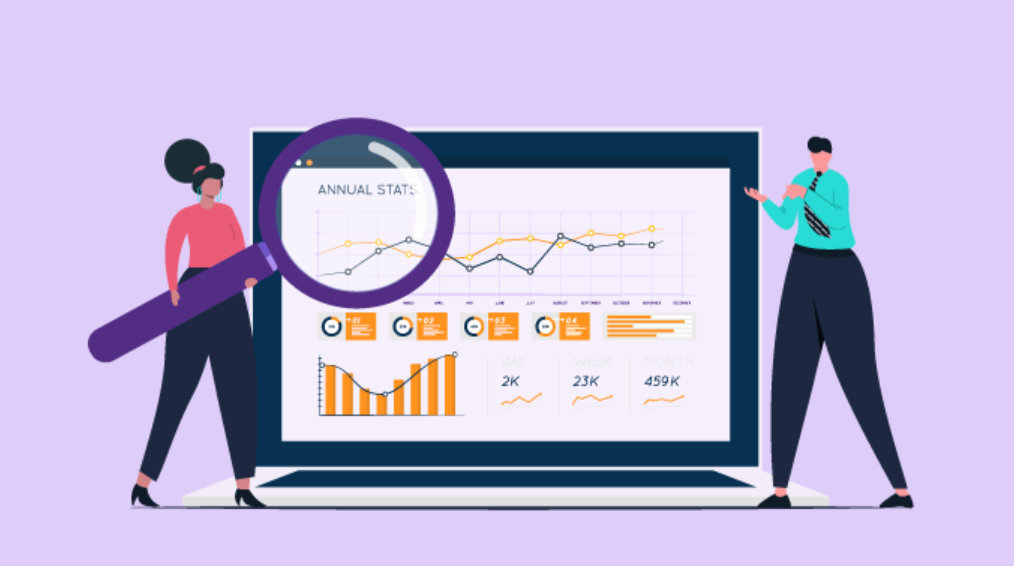
Data visualisation is the art of presenting complex information in a visual format, making it more accessible and understandable. From simple charts and graphs to interactive dashboards, visualisations transform raw data into meaningful insights at a glance. Visualisation enhances comprehension, enabling stakeholders at all levels to grasp trends, patterns, and correlations in KPI data effortlessly.
Choosing the Right Visualisation:
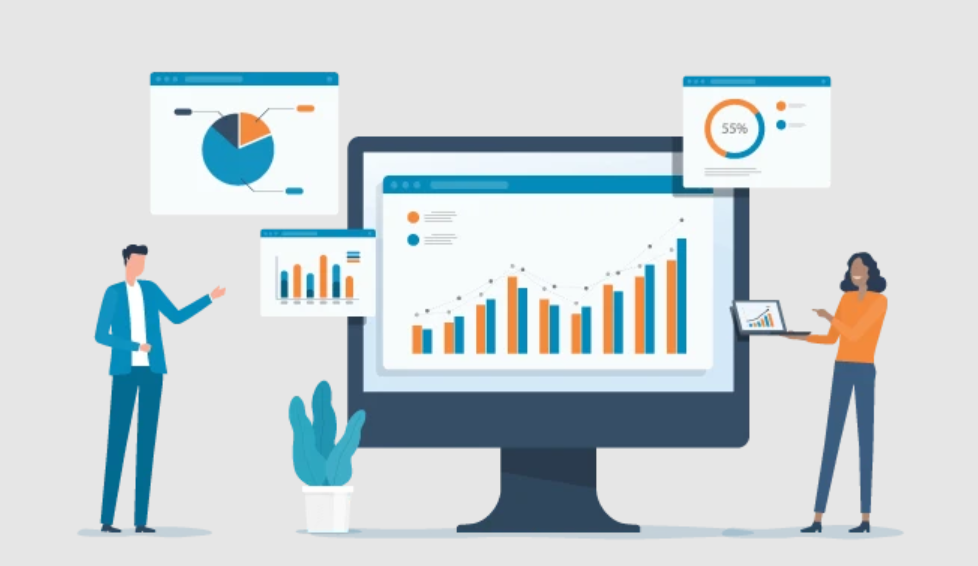
Understanding the nature of your KPI data is key to selecting the appropriate visualisation techniques. Bar charts, line graphs, pie charts, and heat maps each serve different purposes. For example, a line graph might be ideal for showcasing trends over time, while a pie chart could effectively illustrate the distribution of categorical data. By choosing the right visualisation, you ensure that your data is not only presented clearly but also tells a compelling story.
Spotting Trends and Patterns
Spotting trends within your KPI data involves identifying patterns or shifts over time. Whether it’s a gradual increase in website traffic, a seasonal fluctuation in sales, or a sudden spike in user engagement, understanding trends allows businesses to anticipate changes and proactively adjust strategies. Trend analysis is a forward-looking practice that informs decision-making and helps organisations stay ahead of the curve.
A/B Testing for KPI Optimisation
A/B testing embodies the essence of data-driven decision-making. By systematically testing variations and analysing the resulting KPI data, businesses move away from assumptions and preferences, relying instead on concrete evidence. This approach mitigates risks, increases the likelihood of success, and ensures that improvements are grounded in empirical insights.
Mastering the Art of KPIs for Unprecedented Growth
In the dynamic world of digital marketing, where every click counts, mastering the art of KPIs is not just an option – it’s a strategic imperative. So, embark on this journey with us, and unlock the path to sustained success in the ever-evolving landscape of digital analytics.


