

Cohort analysis is a powerful technique used by marketers to dissect user behaviour and interactions in a structured and insightful manner. It groups users who share common characteristics or experiences into cohorts. These cohorts are typically formed based on attributes such as the time they joined, their source of acquisition, or their specific behaviours on a website or app.
By grouping users into cohorts, marketers can observe how different segments of their audience behave over time. This granular approach enables businesses to uncover trends, make data-driven decisions, and enhance their strategies for user engagement and conversion.
Understanding User Behaviour
User behaviour is complex and influenced by a multitude of factors. Cohort analysis is a valuable tool because it goes beyond basic demographic data to dig deep into user behaviour patterns. It takes into account the interactions between users and your product or service, and how these interactions are influenced by external and internal factors.
Cohort analysis helps businesses understand the underlying motivations, preferences, and needs of their audience. It’s a way to peek behind the curtain and gain insights into what drives users to take specific actions or make purchases.
The Importance of Cohort Analysis
Gaining a Competitive Edge
In the fiercely competitive landscape of digital marketing, any advantage can make a significant difference. Cohort analysis is the secret weapon that helps businesses gain a competitive edge. By examining user behaviour in depth and in real-time, companies can stay ahead of industry trends, identify new opportunities, and optimise their strategies to meet evolving user needs.
Marketers who use cohort analysis effectively can respond swiftly to changing market conditions and adjust their tactics to outperform their rivals. This agility is a hallmark of modern marketing success.
Customised Marketing Strategies
One-size-fits-all marketing strategies are becoming obsolete. The modern consumer demands a personalised experience, and this is where cohort analysis shines. By categorising users into distinct cohorts, businesses can tailor their marketing strategies to resonate with each specific group. Each cohort may have its unique needs, preferences, and pain points, and understanding these variations is critical for crafting messages that truly connect.
Cohort analysis allows marketers to create content, offers, and experiences that speak directly to the interests and desires of different segments of their audience. This results in higher engagement, improved conversion rates, and ultimately, increased customer satisfaction.
Enhancing User Retention
User retention is a continual challenge for online businesses. Customers come and go, but effective cohort analysis can help retain and engage them. By studying cohorts of users over time, you can identify when and why users leave or, conversely, why they become loyal customers.
For instance, identifying the factors that influence user churn can lead to strategies to reduce it, such as improving the onboarding process, offering loyalty incentives, or addressing common pain points. In contrast, recognising the characteristics and behaviours of highly engaged users can guide retention efforts, ensuring they remain satisfied and continue to bring in revenue.
By understanding user retention dynamics within different cohorts, businesses can create targeted and effective retention strategies, ultimately boosting customer lifetime value.
Types of Cohort Analysis
1. Time-Based Cohorts
Time-based cohorts group users based on when they first engage with a product or service. For example, you might analyse cohorts of users who signed up in a specific month. This approach helps in understanding how different cohorts evolve over time and how their behaviour changes as they mature.
Time-based cohorts are especially useful for businesses with subscription models, as they can reveal insights into user behaviour throughout their subscription journey. Are there trends in how users engage in their first month versus their third or sixth month? Cohort analysis can provide these answers.
2. Behaviour-Based Cohorts
Behaviour-based cohorts categorise users based on specific actions they’ve taken, such as making a purchase, signing up for a newsletter, or completing a particular task. This type of cohort analysis is particularly valuable for understanding the impact of user actions and identifying which behaviours lead to desired outcomes.
For example, businesses can create cohorts of users who have made a first-time purchase and compare their subsequent behaviour with users who haven’t made a purchase. This analysis can uncover which actions drive conversions and allow businesses to craft strategies to encourage these actions in other user segments.
3. Acquisition Channel Cohorts
Understanding how users found your business is critical for optimising marketing efforts. Acquisition channel cohorts group users based on the sources through which they discovered your product or service. Cohort analysis in this context helps answer questions like:
- Which acquisition channels bring in the most valuable users over time?
- How does user behaviour differ between organic search traffic and paid advertising campaigns?
- Do social media referrals result in long-term customer relationships?
By identifying the most effective acquisition channels and how they impact user behaviour, businesses can allocate their marketing budget more efficiently and focus on channels that yield the highest returns.
Collecting and Organising Data

Data Sources
Effective cohort analysis relies on accurate and comprehensive data. Data can be collected from a variety of sources, including web analytics platforms, customer relationship management (CRM) systems, email marketing tools, and more. It’s essential to ensure that data sources are reliable, up-to-date, and compatible with your analysis needs.
Furthermore, integrating data from multiple sources can provide a more holistic view of user behaviour. For example, combining data from your website analytics with data from your email marketing platform can offer a complete picture of how email campaigns impact user engagement and conversions.
Data Quality
The quality of the data you collect is paramount. Inaccurate or outdated data can lead to incorrect conclusions and misguided decision-making. To maintain data quality, businesses should regularly clean and validate their datasets.
Data cleansing involves identifying and correcting errors in datasets, such as duplicate records, missing values, or inaccuracies. Validation, on the other hand, ensures that data is accurate and consistent by checking it against predefined rules or reference data. By investing in data quality, businesses can have confidence in the insights they gain from cohort analysis.
Data Integration
Data integration is the process of combining data from different sources into a unified view. While it can be complex, it is crucial for understanding user behaviour comprehensively. For example, if you’re running an e-commerce business, you may need to merge data from your online store, customer support platform, and social media channels to behaviour create a 360-degree view of user interactions.
Data integration often involves using middleware or specialised data integration tools. This ensures that data is not only combined but also transformed and standardised, making it ready for analysis.
Data integration enables businesses to identify correlations and patterns that might not be apparent when examining data in isolation. It provides a holistic view of user behaviour and helps create a more accurate and actionable understanding of the audience.
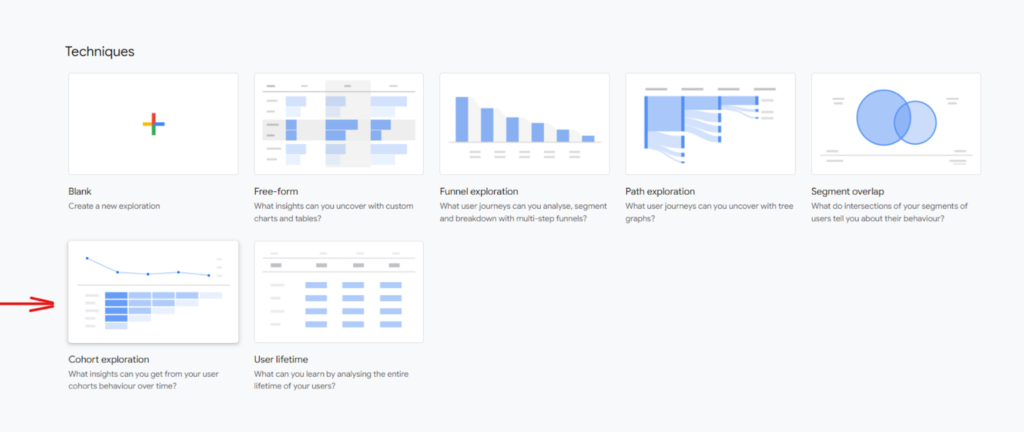
How to Create Cohorts in GA4??
1. Selecting Relevant Metrics
Choosing the right metrics for cohort analysis is a critical step. Metrics should be directly related to your business objectives and the insights you want to gain. Common cohort metrics include retention rates, conversion rates, revenue per user, and engagement levels.
The selection of metrics should align with the specific goals of your cohort analysis. For example, if your primary aim is to improve user retention, you would focus on metrics like repeat purchase rate, and customer lifetime value. On the other hand, if you’re interested in boosting conversion rates, metrics such as click-through rate, lead-to-sale conversion rate, and cart abandonment rate may be more relevant.
2. Defining Cohort Groups
Cohort groups are formed by identifying common characteristics or behaviours that you want to analyse. For instance, if you want to understand the behaviour of users who have made a purchase, you would create cohorts based on this action.
Cohort groups can be defined in numerous ways. They may be based on the user’s first interaction with your platform, such as signing up, or on specific actions like making a purchase or subscribing to a newsletter. Alternatively, you can categorise cohorts by demographic characteristics, such as age, location, or job title, if these factors are relevant to your analysis.
3. Determining Time Periods
The choice of time periods for cohort analysis depends on your specific objectives and the nature of your product or service. Common time periods include daily, weekly, and monthly cohorts.
For instance, if you’re a content-based website, analysing daily cohorts might be appropriate because user engagement can fluctuate significantly from day to day. However, if you’re an e-commerce store, monthly cohorts may be more meaningful, as users tend to exhibit more stable behaviour over the course of a month.
The decision regarding time periods should align with your goals and the granularity of insights you require. Keep in mind that longer time periods may provide a broader perspective but might overlook short-term fluctuations.
Analysing Cohorts
1. Cohort Metrics
Cohort analysis involves the examination of specific metrics over time to understand how different cohorts of users perform. The choice of cohort metrics is crucial and should be tailored to your analysis objectives. Common cohort metrics include:
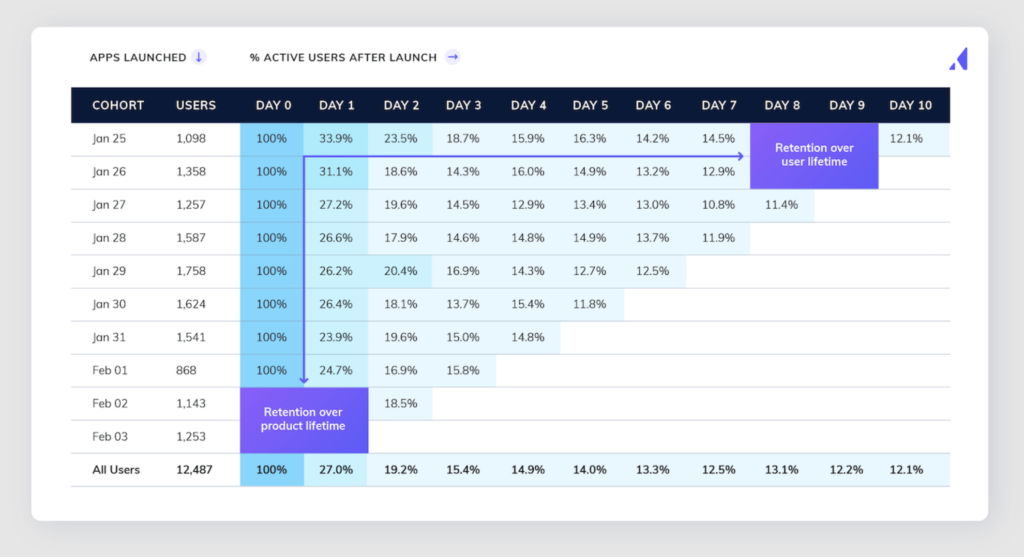
- Retention Rate: This metric shows the percentage of users who continue to use your product or service over a specified period. It helps gauge user loyalty and the effectiveness of retention strategies.
- Conversion Rate: Conversion rates indicate the proportion of users who take a desired action, such as making a purchase or signing up for a newsletter. Analysing conversion rates within cohorts allows businesses to identify which user segments are most likely to convert.
- Revenue per User: This metric measures the average revenue generated by each user within a cohort. It helps assess the profitability of different cohorts and can guide pricing and marketing strategies.
- Engagement Metrics: Metrics like time spent on your website, number of pages viewed, and interactions with specific features can reveal user engagement within cohorts.
By analysing these metrics within cohorts, you can uncover trends and patterns that might be masked when looking at aggregate data. For example, you might discover that users acquired from social media exhibit higher engagement levels but lower conversion rates compared to users from organic search.
2. Cohort Visualisation
Visualising cohort data is a powerful way to present your findings in a compelling and easily digestible format. Several types of visualisations are commonly used in cohort analysis:
- Line Graphs: Line graphs illustrate how cohort metrics change over time for different cohorts. Each line represents a cohort, and by comparing the lines, you can quickly spot trends and variations.
- Heatmaps: Heatmaps provide a visual representation of how cohorts perform relative to each other. They use colour-coding to highlight performance differences, making it easy to see which cohorts are excelling and which are struggling.
- Stacked Bar Charts: Stacked bar charts show how the composition of a cohort changes over time. They can reveal whether a cohort retains a consistent size or if it gradually dwindles as users churn.
Visualising cohort data can simplify the communication of insights to stakeholders and enable quick decision-making. It’s an effective way to bring your cohort analysis results to life.
3. Interpretation of Results
Interpreting cohort analysis results requires a deep understanding of both the data and the broader context of your business. It’s not just about numbers; it’s about the story those numbers tell and the insights they offer.
Effective interpretation involves asking questions like:
- Why are some cohorts performing better than others?
- What factors or events might have influenced a cohort’s behaviour?
- How can we apply these insights to improve our marketing strategies and user experiences?
It’s essential to look beyond the surface and dig deeper into the underlying causes of cohort performance. For instance, if you notice a drop in conversion rates for a specific cohort, consider whether a website redesign, a change in pricing, or external economic factors may have contributed to this decline.
Successful interpretation is the bridge between raw data and actionable insights. It’s where data-driven decisions are formed and conversion optimisation strategies take shape.
Improving User Experience

Tailored Content
User experience extends beyond the user interface; it encompasses the content you deliver. Cohort analysis can help you create content that directly addresses the needs and interests of each cohort, enhancing their overall experience.
For instance, if you discover that a particular cohort of users is highly interested in video content, you can prioritise the creation of video content tailored to their preferences. This not only increases engagement but also enhances the user experience, as users find content that aligns with their interests.
Tailoring content to cohorts isn’t limited to content type; it can also involve content tone, style, and delivery method. Cohort analysis enables businesses to fine-tune their content strategy to create a more enjoyable and relevant experience for all users.
User Journey Mapping
Understanding the user journey is fundamental to improving user experiences. Cohort analysis helps map the unique journeys of different cohorts by identifying the actions they take, the content they engage with, and the touchpoints they encounter.
User journey mapping enables businesses to identify pain points and areas for improvement in each cohort’s interaction with their product or service. It can uncover opportunities to streamline the user journey, provide additional support, or refine the onboarding process.
By aligning user journey mapping with cohort analysis, businesses can identify specific challenges and opportunities within each cohort, allowing for a more tailored and user-centric experience.
Feedback Loops
Leveraging cohort analysis for user feedback loops is a valuable strategy for continuous improvement. Feedback loops involve collecting user feedback and applying it to refine strategies and user experiences.
Cohort analysis plays a crucial role in this process by identifying the cohorts that are most likely to provide valuable feedback. For instance, users who have made multiple purchases or have been engaged for an extended period may have valuable insights to share.
Feedback loops allow businesses to:
- Address user pain points and improve the user experience.
- Iterate on product features or services based on user suggestions.
- Test new strategies or content based on user preferences within specific cohorts.
Cohort analysis guides the collection of feedback and the implementation of changes, ensuring that improvements are aligned with the needs and expectations of specific user segments.
Challenges and Common Mistakes

Data Overload
One of the common pitfalls in cohort analysis is data overload. It’s easy to collect vast amounts of data, but sifting through it can be overwhelming and counterproductive. Focusing on the most relevant data points is essential to prevent analysis paralysis.
To avoid data overload, businesses should:
- Define clear objectives for their cohort analysis.
- Identify the specific metrics and attributes that matter most to their goals.
- Regularly review and refine the data collection process to ensure it aligns with their objectives.
Strategic data collection and analysis are key to generating actionable insights from cohort analysis.
Misinterpretation
Misinterpretation of cohort analysis results can lead to misguided decisions. It’s crucial to interpret the data accurately and within the context of your business. Common misinterpretations include:
- Assuming causation without evidence: Correlation does not necessarily imply causation. Cohort analysis can highlight patterns, but it doesn’t always explain why those patterns exist.
- Ignoring external factors: Cohort analysis often focuses on user behaviour, but external factors, such as market changes or economic conditions, can significantly impact results.
To avoid misinterpretation, it’s important to seek expert guidance when necessary and consider both quantitative and qualitative factors in your analysis.
Lack of Consistency
Inconsistent data collection and analysis can skew results and make it challenging to draw meaningful conclusions. Consistency is essential in several aspects of cohort analysis:
- Data collection methods should be consistent over time to ensure data integrity.
- Cohort definitions should remain stable to allow for accurate comparisons.
- Analysis methodologies should be uniform so that results are reliable and repeatable.
Maintaining consistency in data collection and analysis is critical for producing reliable insights from cohort analysis.
The Future of Cohort Analysis

AI and Machine Learning
The future of cohort analysis holds exciting possibilities with the integration of artificial intelligence (AI) and machine learning. AI-driven cohort analysis promises to provide more robust insights and automation of processes.
Machine learning algorithms can identify intricate patterns and correlations within cohort data that might be challenging for human analysts to uncover. They can predict future user behaviour, helping businesses proactively address trends and opportunities.
AI can also automate the creation of cohorts and segment users based on a broader range of characteristics and behaviours, offering a deeper level of analysis. As AI technologies continue to evolve, cohort analysis is likely to become even more powerful and predictive.
Evolving User Behaviour
User behaviour is not static; it is constantly changing due to new technologies, societal shifts, and cultural developments. Cohort analysis must adapt to these changes to remain relevant and insightful.
Understanding the evolving behaviours of new generations, such as Generation Z, and how they interact with digital products and services is crucial. As user behaviour shifts, so too must the ways in which businesses analyse and respond to it.
The future of cohort analysis will require businesses to be agile in adapting their strategies and understanding the evolving needs and expectations of their users.
Cohort analysis is a potent tool for understanding user behaviour, enhancing conversion rates, and improving the overall user experience.
By mastering the art of cohort analysis, businesses can stay ahead of the curve, outperform their competitors, and build lasting relationships with their users. Start harnessing the power of cohort analysis today, and watch your conversion rates soar.